Contact Us
Gradient
A smarter way to use your data

Every system and every insight, working together

Connect applications, databases and cloud services in one integrated platform. Turn scattered data into clear analytics so every team can see what is happening and act on it.

Data overviewAll integrations and insights in one place
Live
Records synced this month 1.85M 12.8% vs. last month
Active integrations42
Data ActivityMonthly sync volume
Unified Data Integration

Bring applications, databases and cloud services together in one connected view.

Real-Time Analytics

Get live dashboards and reports that help your team make informed decisions.

Automated Data Pipelines

Replace manual data transfers with pipelines that keep information flowing.

Self-Service Reporting

Let every team explore data and build reports without waiting on IT.

The Integration & Analytics Advantage

One connected data platform. Four ways to move forward.

Explore how Integration & Analytics brings intelligence, trusted data, empowered teams and agility together to help your business thrive.

Intelligent Insights

Smarter answers, built into every dataset

Turn integrated data into practical insights. Integration & Analytics helps your team spot trends, understand what needs attention and decide faster with more confidence.

  • Surface useful insights from connected data sources
  • Reduce manual analysis with intelligent assistance
  • Keep teams focused on the next best action
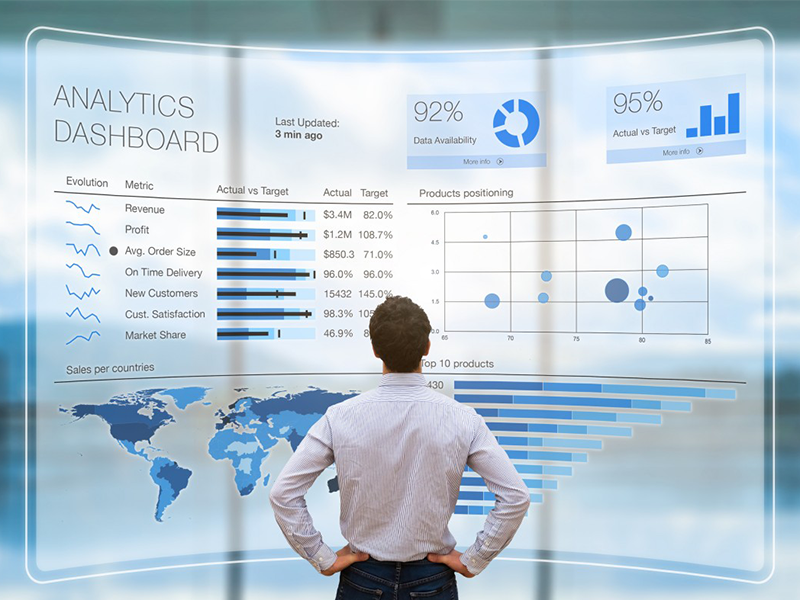
Analytics dashboard with connected data sources
Data Centric

One reliable source of truth for your business

Bring data together from every system and process, so leaders can work from consistent numbers instead of disconnected spreadsheets.

  • Connect all your systems on one platform
  • See clear reports and performance trends
  • Make decisions with timely, trusted data
Analytics dashboard showing business performance data
People Augmented

Give your people the insights to do their best work

Make data easy to use with shared dashboards and simple self-service reports, giving every team more time for the work that matters.

  • Keep teams aligned around shared metrics
  • Simplify data sharing across departments
  • Free people from avoidable manual reporting
A diverse team working together
Enabling Agility

Adapt quickly as your data needs grow

Respond to changing priorities with flexible integrations and analytics that help your business stay organized, adaptable and ready for what comes next.

  • Add new data sources as needs change
  • Track data flows and ownership from one place
  • Scale analytics without adding complexity
A dashboard for tracking data flows and performance
01 / Connected systems

Bring all your data sources into one view

Give teams a shared place to connect and manage data across applications, databases, APIs and cloud services, with fewer gaps between systems.

  • Keep key data from every system together
  • Follow data from source to dashboard
  • Make data ownership clear across teams
Integration workspace
Applications
APIs
Databases
Cloud Services
One connected view across all your data
02 / Clearer decisions

Turn raw data into a clearer picture

Bring important business signals together so teams can review performance, notice changes and decide what needs attention next.

See the bigger pictureReview key metrics in context.
Find what needs attentionDrill into the data behind the numbers.
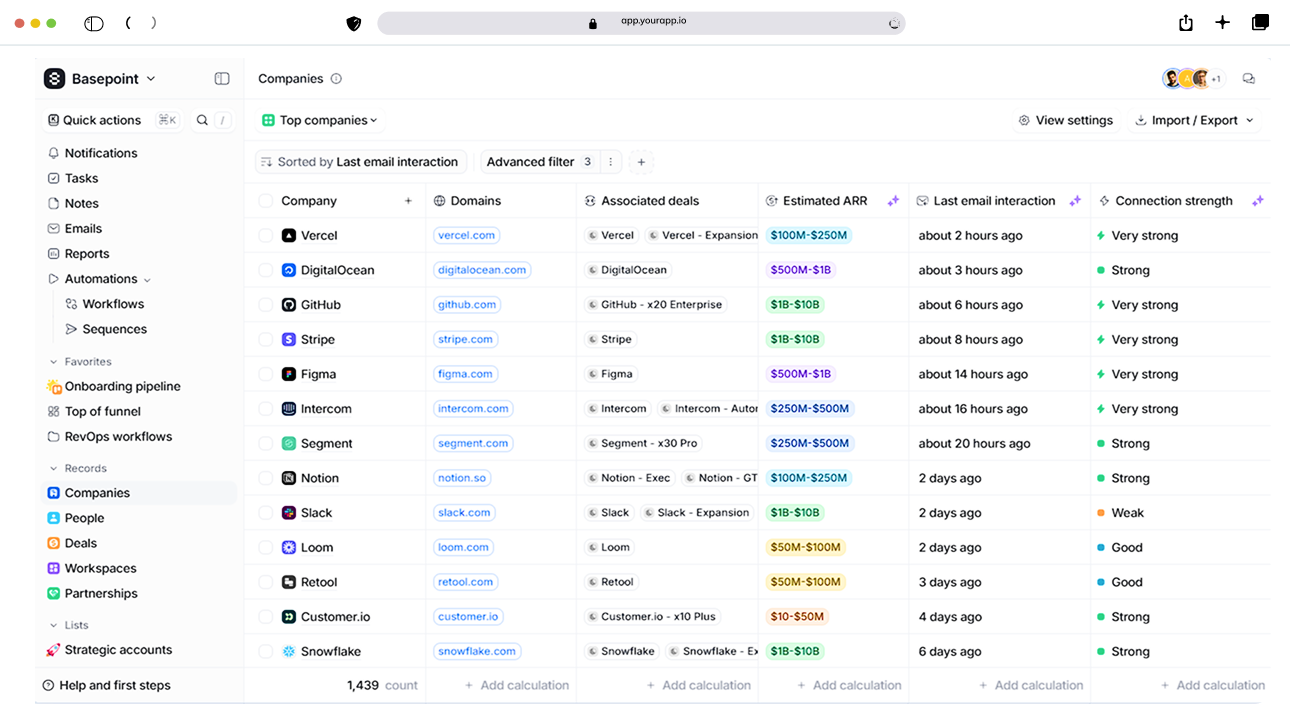
Dashboard with business metrics and analytics
Business insights
At a glance
03 / Smoother data flow

Make data easier to move from source to insight

Connect each step of the data journey so people know where data comes from, who owns it and how it becomes a report.

1

Connect your sourcesLink the systems your team already uses.

2

Unify and prepare dataClean and combine data into one consistent view.

3

Analyze and shareTurn insights into dashboards and reports.

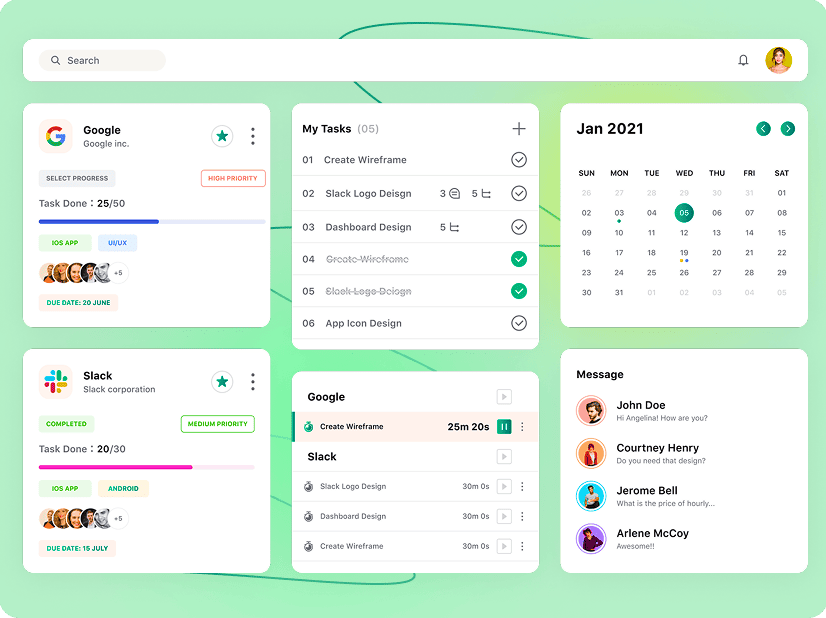
Shared workspace for data pipelines, dashboards and team reports
04 / Ready for what's next

A flexible foundation for the way your data works

Shape connected data and analytics around your teams today, with room to adapt as systems and priorities evolve.

Flexible connectors

Connect new applications and data sources as your business needs change.
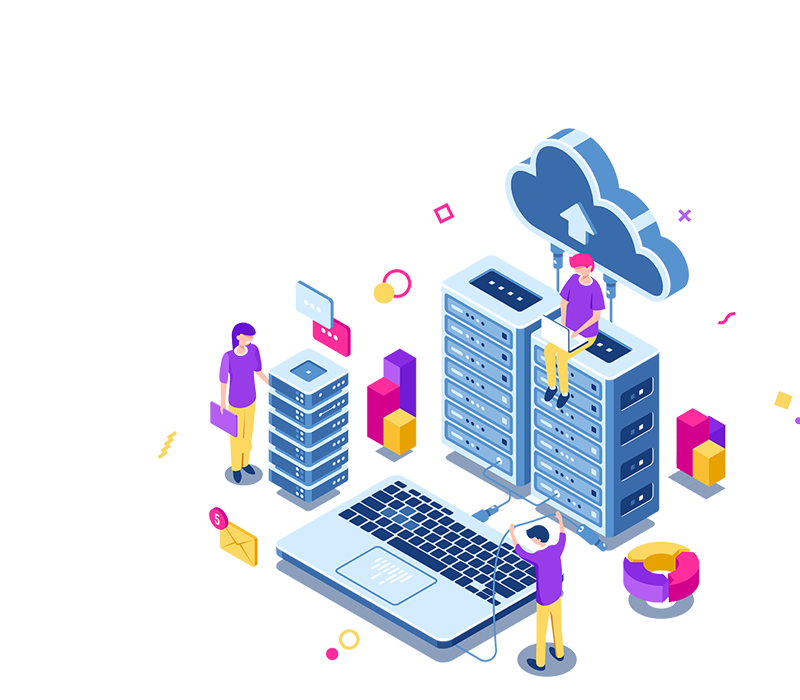
Scalable architecture

Handle growing data volumes and more users without slowing down your teams.

Secure data governance

Give people access to the data relevant to their work, with the right controls in place.

Frequently ask Questions

Find quick answers about how Integration & Analytics works,
who it is for and how to get started with
your business.

Integration & Analytics connects your applications, databases and cloud services into one platform and turns the combined data into dashboards, reports and insights. Instead of working from disconnected systems, your teams get one reliable view of the business.

It removes data silos, cuts manual reporting and gives everyone access to consistent, up-to-date numbers. With automated data flows and clear analytics, your teams can spend less time collecting data and more time acting on it.

Yes. You can start with a few key systems and add more applications, databases or cloud services as your needs grow. The platform is designed to scale without disrupting the integrations already running.

Pricing depends on the number of integrations, the data volume you handle and the number of users who need access to analytics. Get in touch with our team and we will share a clear, transparent quote based on your requirements.

Engagement terms are agreed up front and tailored to your business. We define the scope, data sources and duration together, so you know exactly what to expect from day one.

It can connect to most business applications, databases, cloud platforms and APIs, including finance, sales, HR and operations systems. We help you identify the sources that will deliver the most value first.